
spicy is an R package for publication-ready tables: frequency tables and cross-tabulations, association measures, categorical and continuous summary tables, regression tables for 39 model classes, and labelled survey data workflows.
Every summary and regression table prints as readable text in the console and exports to gt, tinytable, flextable, Excel, Word, or the clipboard, following rigorous reporting conventions – APA by default, with named journal styles. Around the tables, spicy provides the survey-data tools that feed them: variable inspection, codebooks, label extraction, and row-wise summaries.
freq().cross_tab(): percentages, weights,
chi-squared tests, and effect sizes.cramer_v(), phi(), gamma_gk(),
kendall_tau_b(), somers_d() and 6 other coefficients;
assoc_measures() computes the full set at once.table_categorical() and table_continuous(), overall or by group.table_multiresponse(): “check all
that apply” items read as one question, overall or by group, with a
global test that allows for several answers per respondent. The
function is experimental in this release.table_outcome(): one
continuous outcome described across several groupings, one block of
rows per grouping variable, a group comparison per block, and a
marginal Overall row – the transpose of table_continuous(), with
the same statistic vocabulary and output engines.table_continuous_svy() and
table_categorical_svy() on a survey::svydesign object: estimates,
SEs and CIs from the survey package (Taylor linearization or
replicate weights), design degrees of freedom, observed and weighted
counts – the design twins of the two families above, with the same
statistic vocabulary and output engines.table_continuous_lm()
for linear-model reporting: classical / HC* / cluster-robust /
bootstrap / jackknife variance, four effect-size families (f², Cohen’s
d, Hedges’s g, Hays’s omega²) with noncentral CIs, additive covariate
adjustment with G-computation (Stata margins style) or equal-weight
(emmeans style) marginal means, and weighted comparisons.table_regression() for one or more fitted
models side by side, across 39 model classes in 12 families (see
Supported models below): classical / heteroskedasticity-robust /
cluster-robust / bootstrap / jackknife variance with each class’s
field-standard backend, standardized coefficients, family-aware
exponentiate (OR / IRR / HR / RR / MR, link-gated), Wald or
profile-likelihood CIs, average marginal effects (per-category for
ordinal and multinomial models), partial f² / η² / ω² / χ²
effect sizes, class-aware fit statistics (pseudo-R², Nakagawa
marginal / conditional R², ICC), hierarchical model comparisons with
the correct nested test per class (a Wald test on the requested matrix
under a robust or cluster-robust vcov), and multiple-comparison
adjustment. Mixed models report their random effects as table rows
with an optional boundary-correct per-term test; ordinal models report
their thresholds, and cumulative-link mixed models (ordinal::clmm(),
glmmTMB with the ordinal family) both; zero-inflated and hurdle
models report every model component. Survival models go beyond hazard
ratios: adjusted restricted-mean-survival-time and risk differences by
g-computation (tau / at_time), for coxph fits (stratified
included) and survreg AFT fits, in single tables and in the
univariable screen.table_regression_uv():
one-predictor-at-a-time models merged with the multivariable fit,
per-predictor N and events, for glm, lm, and Cox outcomes.spicy_style(): style = "jama", "nejm",
"lancet", "annals", "apa", or "aer" restyles any table, every
rule sourced from each style’s published guidelines. For a French
table, options(spicy.language = "fr") gives the words and the French
typography together.varlist() and vl(): names, labels,
values, classes, distinct values (N_distinct), valid observations
(N_valid), and missing data.code_book(): variables, values, and unweighted
counts, printed in the console, written to Excel, or compiled to a PDF
with a cover, notes (paragraphs, lists, italics, bold, code, links),
one sheet per variable, and an index.label_from_names(), including
LimeSurvey-style headers.mean_n(), sum_n(), and count_n(),
with explicit control over missing values.Works with labelled, factor, ordered, Date, POSIXct, and other
common variable types – and honors declared missing values (haven’s
na_values/na_range, tagged NAs) across the descriptive functions,
with disclosure notes and a user_na escape hatch. For a full
introduction, see Getting started with
spicy.
events/N counts, reference rows, block
structure, captions, and disclosure notes included. What you publish
is what you saw.survival::concordance(), exact order-statistic confidence intervals
for medians), and each convention is documented where the number is
produced.as_structured() returns the
complete typed view of a regression or summary table – values,
precisions, significance markers, row roles – with an explicit
contract version, so custom renderers and downstream pipelines can
detect changes instead of silently mis-reading them.table_regression() accepts a single fit or a list of fits from any of
these classes, and renders them with the conventions of each model
family:
| Family | Engines |
|---|---|
| Linear and generalized linear |
stats::lm(), stats::glm(), MASS::glm.nb(), MASS::rlm(), stats::nls()
|
| Robust, IV, quantile, panel |
estimatr::lm_robust(), estimatr::iv_robust(), AER::ivreg(), AER::tobit(), quantreg::rq(), fixest::feols(), fixest::feglm(), fixest::fepois(), fixest::fenegbin()
|
| Mixed effects |
lme4::lmer(), lme4::glmer(), glmmTMB::glmmTMB(), nlme::lme(), nlme::gls()
|
| Ordinal and categorical |
MASS::polr(), ordinal::clm() (incl. partial proportional odds), ordinal::clmm(), glmmTMB::glmmTMB() (ordinal family), nnet::multinom(), mlogit::mlogit()
|
| Counts, two-part models |
pscl::hurdle(), pscl::zeroinfl(), glmmTMB::glmmTMB() (zero-inflation and dispersion components) |
| Survival |
survival::coxph(), survival::survreg(), rms::cph(), flexsurv::flexsurvreg()
|
| Survey-weighted |
survey::svyglm(), survey::svyolr(), survey::svycoxph() (design-based SEs) |
| Population-averaged (GEE) |
geepack::geeglm() (native sandwich SEs, working correlation disclosed) |
| Additive, proportions, selection |
mgcv::gam(), mgcv::bam(), betareg::betareg(), sampleSelection::selection()
|
| rms |
rms::ols(), rms::lrm(), rms::Glm()
|
| Bayesian |
rstanarm::stan_glm(), rstanarm::stan_glmer(), brms::brm() (posterior median, credible intervals, no p-values) |
Class-specific structure renders as labeled blocks in the same table: random effects (with SE and CI on each variance component, and an optional boundary-correct per-term likelihood-ratio test), ordinal thresholds, non-proportional effects, zero-inflation and dispersion components. Robust variance requests use each class’s field-standard backend and are refused with a clear message when no valid backend exists.
The full capability map – each family’s marginal-effects estimand,
exponentiate semantics, robust-variance backends and
standardized-coefficient support – is the Supported
models
article; table_regression_models() returns the same registry as a data
frame.
Install the current CRAN release, recommended for most users:
install.packages("spicy")
Install the latest r-universe build:
install.packages(
  "spicy",
  repos = c(
    "https://amaltawfik.r-universe.dev",
    "https://cloud.r-project.org"
  )
)
This installs spicy from r-universe when available; CRAN is included
only as a fallback for dependencies. The r-universe build may be newer
than the current CRAN release.
Install the development version from GitHub with pak:
# install.packages("pak")
pak::pak("amaltawfik/spicy")
Or with remotes:
# install.packages("remotes")
remotes::install_github("amaltawfik/spicy")
The examples below use the bundled sochealth dataset.
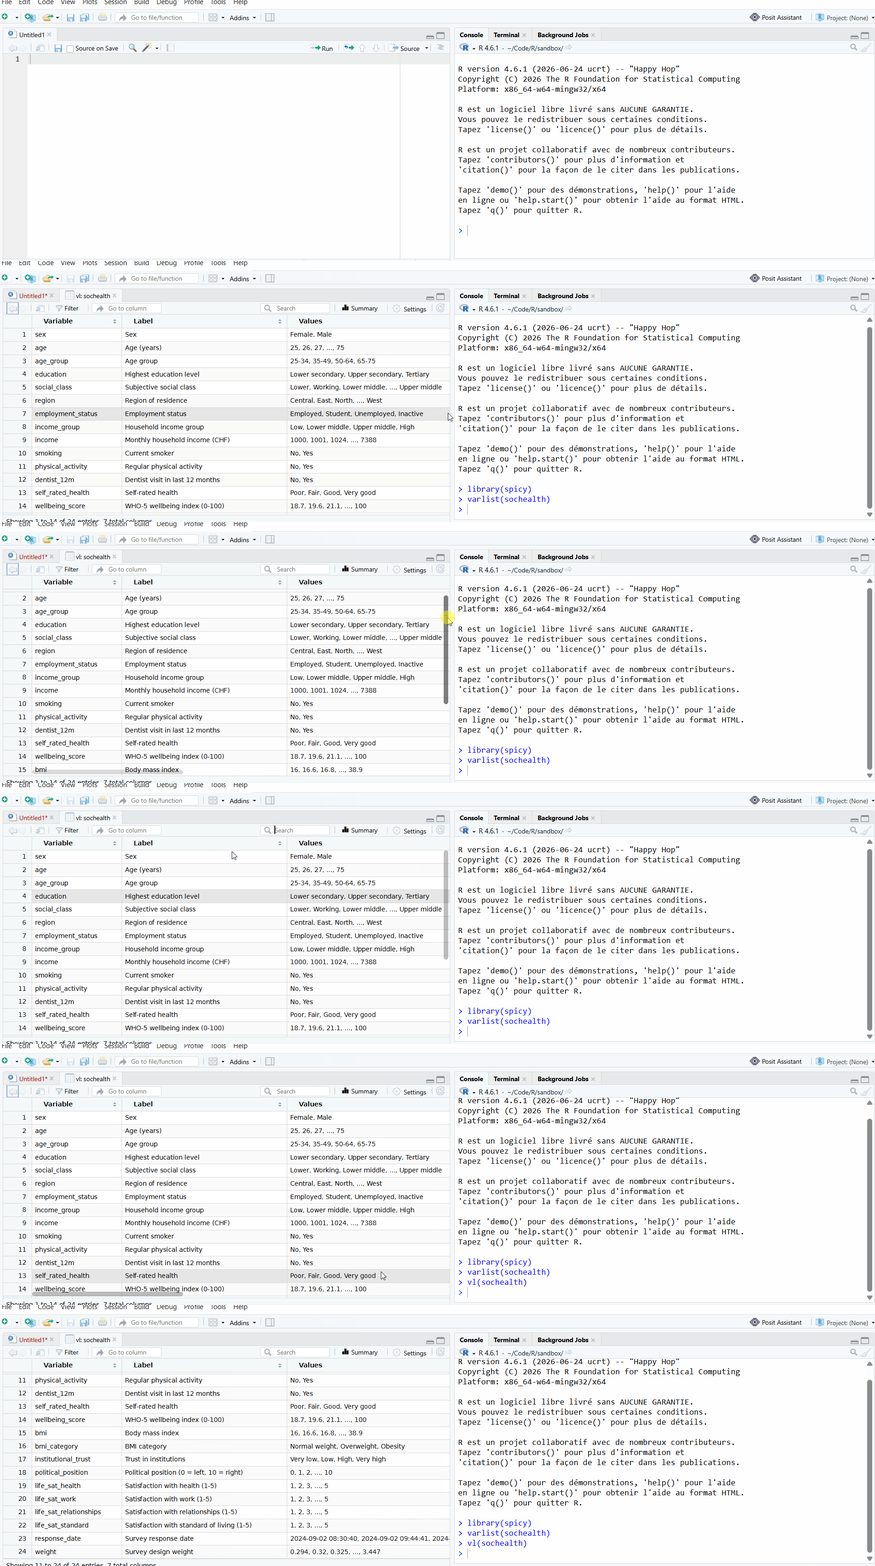
varlist(sochealth, tbl = TRUE)
#> # A tibble: 29 × 7
#>    Variable          Label                 Values Class N_distinct N_valid   NAs
#>    <chr>             <chr>                 <chr>  <chr>      <int>   <int> <int>
#>  1 sex               Sex                   Femal… fact…          2    1200     0
#>  2 age               Age (years)           25, 2… nume…         51    1200     0
#>  3 age_group         Age group             25-34… orde…          4    1200     0
#>  4 education         Highest education le… Lower… orde…          3    1200     0
#>  5 social_class      Subjective social cl… Lower… orde…          5    1200     0
#>  6 region            Region of residence   Centr… fact…          6    1200     0
#>  7 employment_status Employment status     Emplo… fact…          4    1200     0
#>  8 income_group      Household income gro… Low, … orde…          4    1182    18
#>  9 income            Monthly household in… 1000,… nume…       1052    1200     0
#> 10 smoking           Current smoker        No, Y… fact…          2    1175    25
#> # ℹ 19 more rows
code_book() documents a data frame: the list of variables in the
console, an Excel workbook, or a PDF with a cover, a page about the
data, one sheet per variable, and an index. The notes take paragraphs
and list items, with italics, bold, code, and links.
code_book(
  sochealth,
  title = "Social health survey",
  subtitle = "Simulated data shipped with spicy",
  authors = list(
    list(
      name = "Jane Doe",
      affiliation = "University of Somewhere",
      orcid = "0000-0002-1825-0097"
    ),
    list(name = "John Doe", affiliation = "Somewhere Institute of Public Health")
  ),
  notes = c(
    "Simulated data shipped with *spicy* (`?sochealth`): 1,200 respondents of a fictitious social health survey.",
    "- `weight` is the survey design weight: the counts of this codebook are **unweighted**."
  ),
  output = "sochealth_codebook.pdf"
)
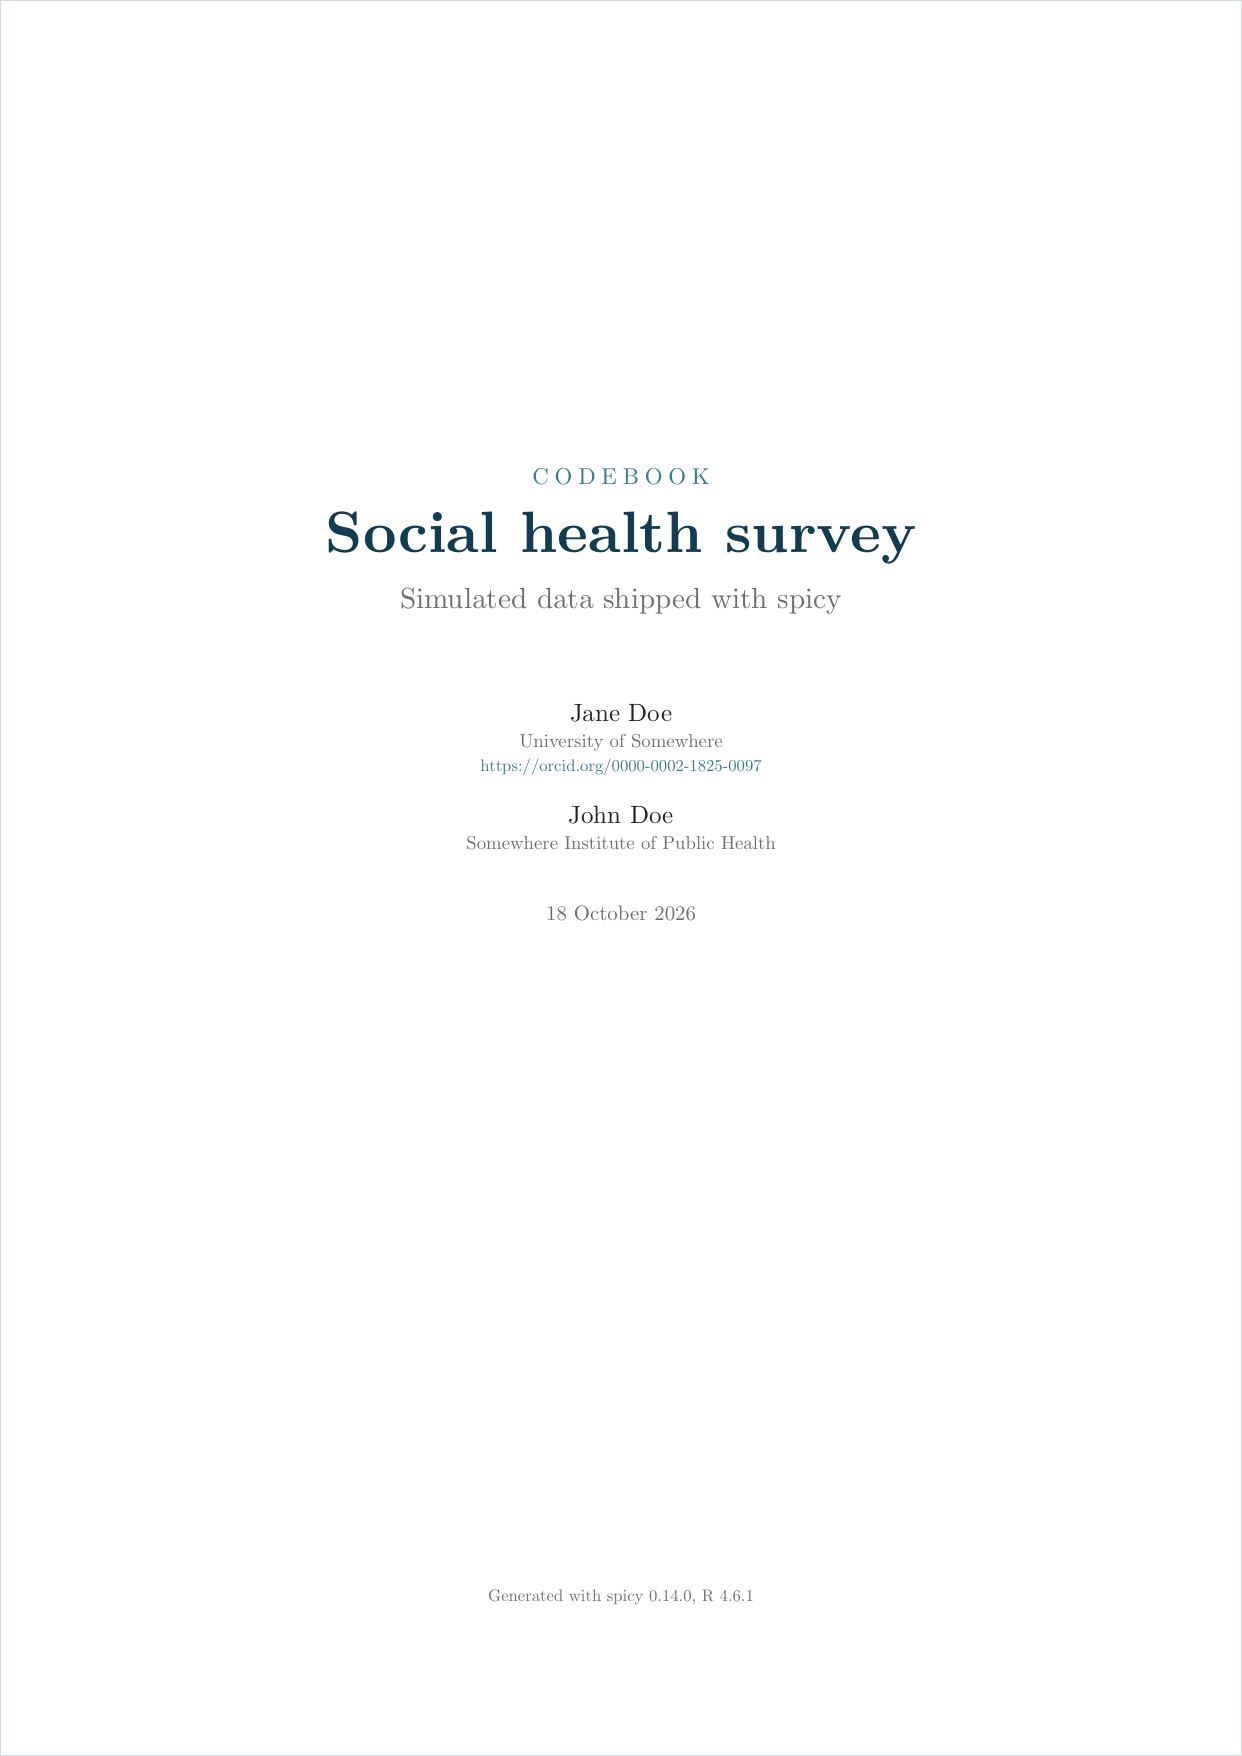
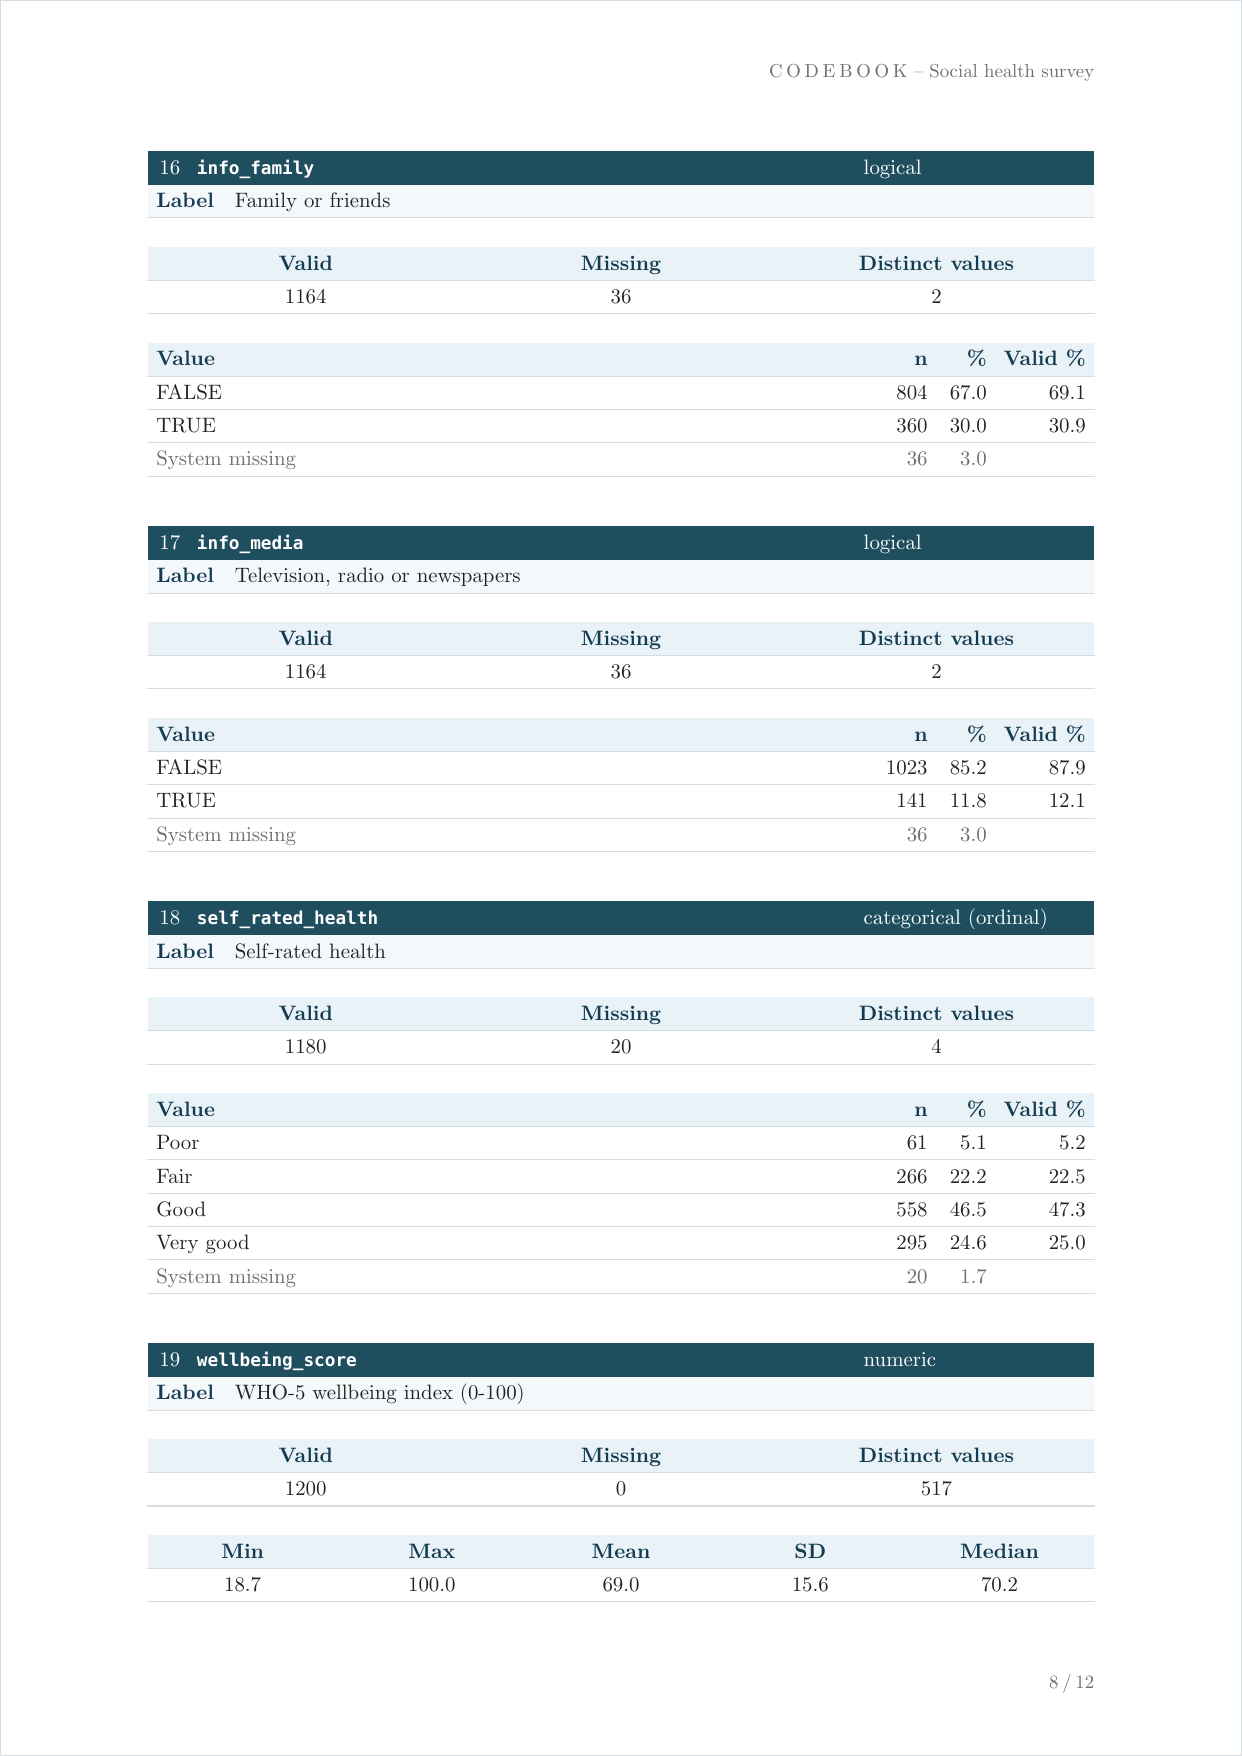
The whole document: the
PDF,
the same in
French,
and the Excel
workbook.
See Explore variables and build
codebooks
for more on varlist(), vl(), and code_book().
freq(sochealth, income_group)
#> Frequency table: income_group
#>
#>  Category   │ Values            Freq.    Percent    Valid Percent
#> ────────────┼─────────────────────────────────────────────────────
#>  Valid      │ Low                 247       20.6             20.9
#>             │ Lower middle        388       32.3             32.8
#>             │ Upper middle        328       27.3             27.7
#>             │ High                219       18.2             18.5
#>  Missing    │ NA                   18        1.5
#> ────────────┼─────────────────────────────────────────────────────
#>  Total      │                    1200      100.0            100.0
#>
#> Label: Household income group
#> Class: ordered, factor
#> Data: sochealth

cross_tab(sochealth, smoking, education, percent = "col")
#> Crosstable: smoking x education (Column %)
#>
#>  Values   │   Lower secondary    Upper secondary    Tertiary │   Total
#> ──────────┼──────────────────────────────────────────────────┼─────────
#>  No       │              69.6               78.7        84.9 │    78.8
#>  Yes      │              30.4               21.3        15.1 │    21.2
#> ──────────┼──────────────────────────────────────────────────┼─────────
#>  Total    │             100.0              100.0       100.0 │   100.0
#>  N        │               257                527         391 │    1175
#>
#> Chi-2(2) = 21.6, p < .001
#> Cramér's V = 0.14
#> Missing values removed: smoking (25).
See Frequency tables and
cross-tabulations
for freq(), cross_tab(), percentages, weights, and tests.
tbl <- xtabs(~ self_rated_health + education, data = sochealth)

# Quick scalar estimate
cramer_v(tbl)
#> [1] 0.1761697

# Detailed result with CI and p-value
cramer_v(tbl, detail = TRUE)
#> Estimate  SE  CI lower  CI upper      p
#>    0.176   –     0.120     0.231  <.001
See Cramér’s V, Phi, and association measures for a guide on choosing the right measure.
table_categorical(
  sochealth,
  select = c(smoking, physical_activity),
  labels = c(
    smoking           = "Current smoker",
    physical_activity = "Physical activity"
  )
)
#> Categorical table
#>
#>  Variable            │   n      %
#> ─────────────────────┼───────────────
#>  Current smoker      │
#>    No                │  926    78.8
#>    Yes               │  249    21.2
#>    (Missing)         │   25
#> ╌╌╌╌╌╌╌╌╌╌╌╌╌╌╌╌╌╌╌╌╌┼╌╌╌╌╌╌╌╌╌╌╌╌╌╌╌
#>  Physical activity   │
#>    No                │  650    54.2
#>    Yes               │  550    45.8
#>
#> Note. N = 1200.
table_categorical(
  sochealth,
  select = c(smoking, physical_activity),
  by = education,
  labels = c(
    smoking           = "Current smoker",
    physical_activity = "Physical activity"
  )
)
#> Categorical table by education
#>
#>  Variable          │ Lower secondary n  Lower secondary %  Upper secondary n
#> ───────────────────┼─────────────────────────────────────────────────────────
#>  Current smoker    │
#>    No              │        179               69.6                415
#>    Yes             │         78               30.4                112
#>    (Missing)       │          4                                    12
#> ╌╌╌╌╌╌╌╌╌╌╌╌╌╌╌╌╌╌╌┼╌╌╌╌╌╌╌╌╌╌╌╌╌╌╌╌╌╌╌╌╌╌╌╌╌╌╌╌╌╌╌╌╌╌╌╌╌╌╌╌╌╌╌╌╌╌╌╌╌╌╌╌╌╌╌╌╌
#>  Physical activity │
#>    No              │        177               67.8                310
#>    Yes             │         84               32.2                229
#>
#>  Variable          │ Upper secondary %  Tertiary n  Tertiary %  Total n
#> ───────────────────┼────────────────────────────────────────────────────
#>  Current smoker    │
#>    No              │       78.7            332         84.9       926
#>    Yes             │       21.3             59         15.1       249
#>    (Missing)       │                         9                     25
#> ╌╌╌╌╌╌╌╌╌╌╌╌╌╌╌╌╌╌╌┼╌╌╌╌╌╌╌╌╌╌╌╌╌╌╌╌╌╌╌╌╌╌╌╌╌╌╌╌╌╌╌╌╌╌╌╌╌╌╌╌╌╌╌╌╌╌╌╌╌╌╌╌
#>  Physical activity │
#>    No              │       57.5            163         40.8       650
#>    Yes             │       42.5            237         59.2       550
#>
#>  Variable          │ Total %    p     V
#> ───────────────────┼─────────────────────
#>  Current smoker    │          <.001  .14
#>    No              │  78.8
#>    Yes             │  21.2
#>    (Missing)       │
#> ╌╌╌╌╌╌╌╌╌╌╌╌╌╌╌╌╌╌╌┼╌╌╌╌╌╌╌╌╌╌╌╌╌╌╌╌╌╌╌╌╌
#>  Physical activity │          <.001  .21
#>    No              │  54.2
#>    Yes             │  45.8
#>
#> Note. N = 1200: Lower secondary (n = 261), Upper secondary (n = 539), Tertiary (n = 400). Percentages are column percentages. P-values: Pearson chi-squared test. V = Cramér's V.
table_continuous(
  sochealth,
  select = c(bmi, life_sat_health)
)
#> Descriptive statistics
#>
#>  Variable        │   M     SD    Min    Max   95% CI LL  95% CI UL   n
#> ─────────────────┼───────────────────────────────────────────────────────
#>  bmi             │ 25.93  3.72  16.00  38.90    25.72      26.14    1188
#>  life_sat_health │  3.55  1.25   1.00   5.00     3.48       3.62    1192
#>
#> Note. N = 1200. Missing values removed: bmi (12), life_sat_health (8). CI = confidence interval; LL = lower limit; UL = upper limit.
table_continuous(
  sochealth,
  select = c(bmi, life_sat_health),
  by = education
)
#> Descriptive statistics by education
#>
#>  Variable        │ Group              M     SD    Min    Max   95% CI LL
#> ─────────────────┼───────────────────────────────────────────────────────
#>  bmi             │ Lower secondary  28.09  3.47  18.20  38.90    27.66
#>                  │ Upper secondary  26.02  3.43  16.00  37.10    25.73
#>                  │ Tertiary         24.39  3.52  16.00  33.00    24.04
#> ╌╌╌╌╌╌╌╌╌╌╌╌╌╌╌╌╌┼╌╌╌╌╌╌╌╌╌╌╌╌╌╌╌╌╌╌╌╌╌╌╌╌╌╌╌╌╌╌╌╌╌╌╌╌╌╌╌╌╌╌╌╌╌╌╌╌╌╌╌╌╌╌╌
#>  life_sat_health │ Lower secondary   2.71  1.20   1.00   5.00     2.57
#>                  │ Upper secondary   3.53  1.19   1.00   5.00     3.43
#>                  │ Tertiary          4.11  1.04   1.00   5.00     4.01
#>
#>  Variable        │ Group            95% CI UL   n     p
#> ─────────────────┼────────────────────────────────────────
#>  bmi             │ Lower secondary    28.51    260  <.001
#>                  │ Upper secondary    26.31    534
#>                  │ Tertiary           24.74    394
#> ╌╌╌╌╌╌╌╌╌╌╌╌╌╌╌╌╌┼╌╌╌╌╌╌╌╌╌╌╌╌╌╌╌╌╌╌╌╌╌╌╌╌╌╌╌╌╌╌╌╌╌╌╌╌╌╌╌╌
#>  life_sat_health │ Lower secondary     2.86    259  <.001
#>                  │ Upper secondary     3.63    534
#>                  │ Tertiary            4.21    399
#>
#> Note. N = 1200: Lower secondary (n = 261), Upper secondary (n = 539), Tertiary (n = 400). Missing values removed: bmi (12), life_sat_health (8). P-values: Welch one-way ANOVA. CI = confidence interval; LL = lower limit; UL = upper limit.
table_continuous_lm(
  sochealth,
  select = c(wellbeing_score, bmi),
  by = sex,
  vcov = "HC3",
  output = "data.frame"
)
#>          variable           label M (Female) M (Male)         Δ  95% CI LL
#> 1 wellbeing_score wellbeing_score   67.16194 71.04879 3.8868576 2.12265210
#> 2             bmi             bmi   25.68506 26.19685 0.5117882 0.08904596
#>   95% CI UL            p          R²    n
#> 1 5.6510631 1.670572e-05 0.015475137 1200
#> 2 0.9345305 1.769614e-02 0.004728908 1188
fit <- lm(wellbeing_score ~ age + sex + smoking, data = sochealth)
table_regression(fit)
#> Linear regression: wellbeing_score
#>
#>  Variable        │    B      SE       95% CI        p
#> ─────────────────┼──────────────────────────────────────
#>  (Intercept)     │   65.20  1.66  [61.95, 68.45]  <.001
#>  age             │    0.05  0.03  [-0.01,  0.11]   .130
#>  sex:            │
#>    Female (ref.) │     –     –          –          –
#>    Male          │    3.86  0.91  [ 2.08,  5.63]  <.001
#>  smoking:        │
#>    No (ref.)     │     –     –          –          –
#>    Yes           │   -1.72  1.11  [-3.89,  0.45]   .121
#> ╌╌╌╌╌╌╌╌╌╌╌╌╌╌╌╌╌┼╌╌╌╌╌╌╌╌╌╌╌╌╌╌╌╌╌╌╌╌╌╌╌╌╌╌╌╌╌╌╌╌╌╌╌╌╌╌
#>  n               │ 1175
#>  R²              │    0.02
#>  Adj. R²         │    0.02
#>
#> Note. Linear regression. Std. errors: classical (OLS). CI = confidence interval.
Regression tables cover 39 model classes with the conventions of each family. A mixed-effects fit, for example, reports its random effects as rows (SD, correlation, residual – each with SE and CI), the ICC and group sizes as fit statistics, and the likelihood-ratio test of the random part with the boundary-correct chi-bar-squared p-value:
library(lme4)
fit_mixed <- lmer(Reaction ~ Days + (Days | Subject), data = sleepstudy)
table_regression(fit_mixed)
#> Linear mixed-effects regression: Reaction
#>
#>  Variable                        │    B      SE        95% CI         p
#> ─────────────────────────────────┼────────────────────────────────────────
#>  (Intercept)                     │  251.41  6.82  [238.03, 264.78]  <.001
#>  Days                            │   10.47  1.55  [  7.44,  13.50]  <.001
#> ╌╌╌╌╌╌╌╌╌╌╌╌╌╌╌╌╌╌╌╌╌╌╌╌╌╌╌╌╌╌╌╌╌┼╌╌╌╌╌╌╌╌╌╌╌╌╌╌╌╌╌╌╌╌╌╌╌╌╌╌╌╌╌╌╌╌╌╌╌╌╌╌╌╌
#>  Random effects:                 │
#>    σ Subject (Intercept)         │   24.74  5.84  [  6.79,  34.32]   –
#>    σ Subject Days                │    5.92  1.25  [  2.47,   8.00]   –
#>    ρ Subject ((Intercept), Days) │    0.07  0.33  [ -0.57,   0.70]   –
#>    σ (Residual)                  │   25.59  1.51  [ 22.44,  28.39]   –
#> ╌╌╌╌╌╌╌╌╌╌╌╌╌╌╌╌╌╌╌╌╌╌╌╌╌╌╌╌╌╌╌╌╌┼╌╌╌╌╌╌╌╌╌╌╌╌╌╌╌╌╌╌╌╌╌╌╌╌╌╌╌╌╌╌╌╌╌╌╌╌╌╌╌╌
#>  n                               │  180
#>  N (Subject)                     │   18
#>  R² (marginal)                   │    0.28
#>  R² (conditional)                │    0.80
#>  AIC                             │ 1755.6
#>  BIC                             │ 1774.8
#>
#> Note. Linear mixed-effects regression. Std. errors: Wald (model-based). P-values: Wald-z, large-sample approximation. Load `lmerTest` for Satterthwaite t-tests. Random effects (REML): LR test vs linear regression, χ̄²(3) = 150.04, p < .001. CI = confidence interval; AIC = Akaike information criterion; BIC = Bayesian information criterion.
See Categorical summary
tables
for categorical summaries, Continuous summary
tables
for continuous summaries and group comparisons, Model-based continuous
summary
tables
for weighted or robust linear-model reporting, Publication-ready
regression
tables
for table_regression() across model families, and Summary tables for
reporting
for an overview of summary tables.
The same numbers can be laid out outcome-first: one outcome, several groupings, one block per grouping.
table_outcome(
  sochealth,
  outcome = bmi,
  select = c(sex, smoking)
)
#> Descriptive statistics of bmi
#>
#>  Variable    │   M     SD    Min    Max   95% CI LL  95% CI UL   n     p
#> ─────────────┼─────────────────────────────────────────────────────────────
#>  Overall     │ 25.93  3.72  16.00  38.90    25.72      26.14    1188
#> ╌╌╌╌╌╌╌╌╌╌╌╌╌┼╌╌╌╌╌╌╌╌╌╌╌╌╌╌╌╌╌╌╌╌╌╌╌╌╌╌╌╌╌╌╌╌╌╌╌╌╌╌╌╌╌╌╌╌╌╌╌╌╌╌╌╌╌╌╌╌╌╌╌╌╌
#>  sex         │                                                        .018
#>    Female    │ 25.69  3.78  16.00  38.90    25.39      25.98     616
#>    Male      │ 26.20  3.64  16.00  37.70    25.90      26.50     572
#> ╌╌╌╌╌╌╌╌╌╌╌╌╌┼╌╌╌╌╌╌╌╌╌╌╌╌╌╌╌╌╌╌╌╌╌╌╌╌╌╌╌╌╌╌╌╌╌╌╌╌╌╌╌╌╌╌╌╌╌╌╌╌╌╌╌╌╌╌╌╌╌╌╌╌╌
#>  smoking     │                                                        .903
#>    No        │ 25.96  3.76  16.00  38.90    25.72      26.21     915
#>    Yes       │ 25.93  3.58  16.80  35.30    25.48      26.38     248
#>    (Missing) │ 24.74  3.63  17.60  32.50    23.24      26.23      25
#>
#> Note. N = 1200. Missing values removed: bmi (12). P-values: Welch t-test. Each block compares bmi across the levels of one variable, without controlling for the other variables. Overall = the whole analytic sample. CI = confidence interval; LL = lower limit; UL = upper limit.
A “check all that apply” question gets a table of its own, one row per
item. In sochealth, five logical items record the sources of health
information a respondent used in the past 12 months. The article
Multiple-response
questions
explains the bases, the percentages and the tests.
table_multiresponse(
  sochealth,
  select = starts_with("info_"),
  by = sex
)
#> Multiple responses by sex
#>
#>  Variable         │ Female n  Female %  Male n  Male %  Total n  Total %    p
#> ──────────────────┼─────────────────────────────────────────────────────────────
#>  info_doctor      │   377       62.9     344     60.9     721     61.9    1.000
#>  info_pharmacist  │   137       22.9     119     21.1     256     22.0    1.000
#>  info_internet    │   268       44.7     255     45.1     523     44.9    1.000
#>  info_family      │   219       36.6     141     25.0     360     30.9    <.001
#>  info_media       │    78       13.0      63     11.2     141     12.1    1.000
#>  (No item chosen) │    31        5.2      36      6.4      67      5.8     –
#> ╌╌╌╌╌╌╌╌╌╌╌╌╌╌╌╌╌╌┼╌╌╌╌╌╌╌╌╌╌╌╌╌╌╌╌╌╌╌╌╌╌╌╌╌╌╌╌╌╌╌╌╌╌╌╌╌╌╌╌╌╌╌╌╌╌╌╌╌╌╌╌╌╌╌╌╌╌╌╌╌
#>  Base             │   599                565             1164
#>
#> Note. Multiple answers possible: percentages can sum to more than 100%. Base: respondents who answered the question (excluded: 36 with no answer to the question). Item p-values: Pearson chi-squared test of each item by group. Adjusted for 5 tests (Holm method). Overall group comparison: Rao-Scott second-order corrected chi-squared test of multiple marginal independence, χ²(4.61) = 18.78, p = .002.
df <- data.frame(
  x1 = c(10, NA, 30, 40, 50),
  x2 = c(5, NA, 15, NA, 25),
  x3 = c(NA, 30, 20, 50, 10)
)

mean_n(df)
#> [1]       NA       NA 21.66667       NA 28.33333
sum_n(df, min_valid = 2)
#> [1] 15 NA 65 90 85
count_n(df, special = "NA")
#> [1] 1 2 0 1 0
See Getting started with
spicy for a
longer workflow using mean_n(), sum_n(), and count_n().
# LimeSurvey-style headers: "code. label"
df <- tibble::tibble(
  "age. Age of respondent" = c(25, 30),
  "score. Total score" = c(12, 14)
)
out <- label_from_names(df)
labelled::var_label(out)
#> $age
#> [1] "Age of respondent"
#>
#> $score
#> [1] "Total score"
See Explore variables and build
codebooks
for more on label_from_names(), varlist(), and code_book().
Each workflow has a dedicated article on the package site:
Key reference pages:
freq(),
cross_tab(),
cramer_v(),
table_categorical(),
table_continuous(),
table_continuous_lm(),
table_regression(),
varlist(),
code_book(),
label_from_names(),
mean_n(),
sum_n(),
and
count_n()
– see the full function
index for
everything else.
To cite spicy in a publication or teaching material (this entry is
generated by citation("spicy") at build time and always refers to the
current CRAN release):
Tawfik A (2026). spicy: Publication-Ready Tables for Descriptive Statistics and Regression Models. doi:10.32614/CRAN.package.spicy https://doi.org/10.32614/CRAN.package.spicy. R package version 0.14.0, https://CRAN.R-project.org/package=spicy.
@Manual{,
  title = {spicy: Publication-Ready Tables for Descriptive Statistics and Regression Models},
  author = {Amal Tawfik},
  year = {2026},
  note = {R package version 0.14.0},
  url = {https://CRAN.R-project.org/package=spicy},
  doi = {10.32614/CRAN.package.spicy},
}
MIT. See LICENSE for details.